
18 February 2018
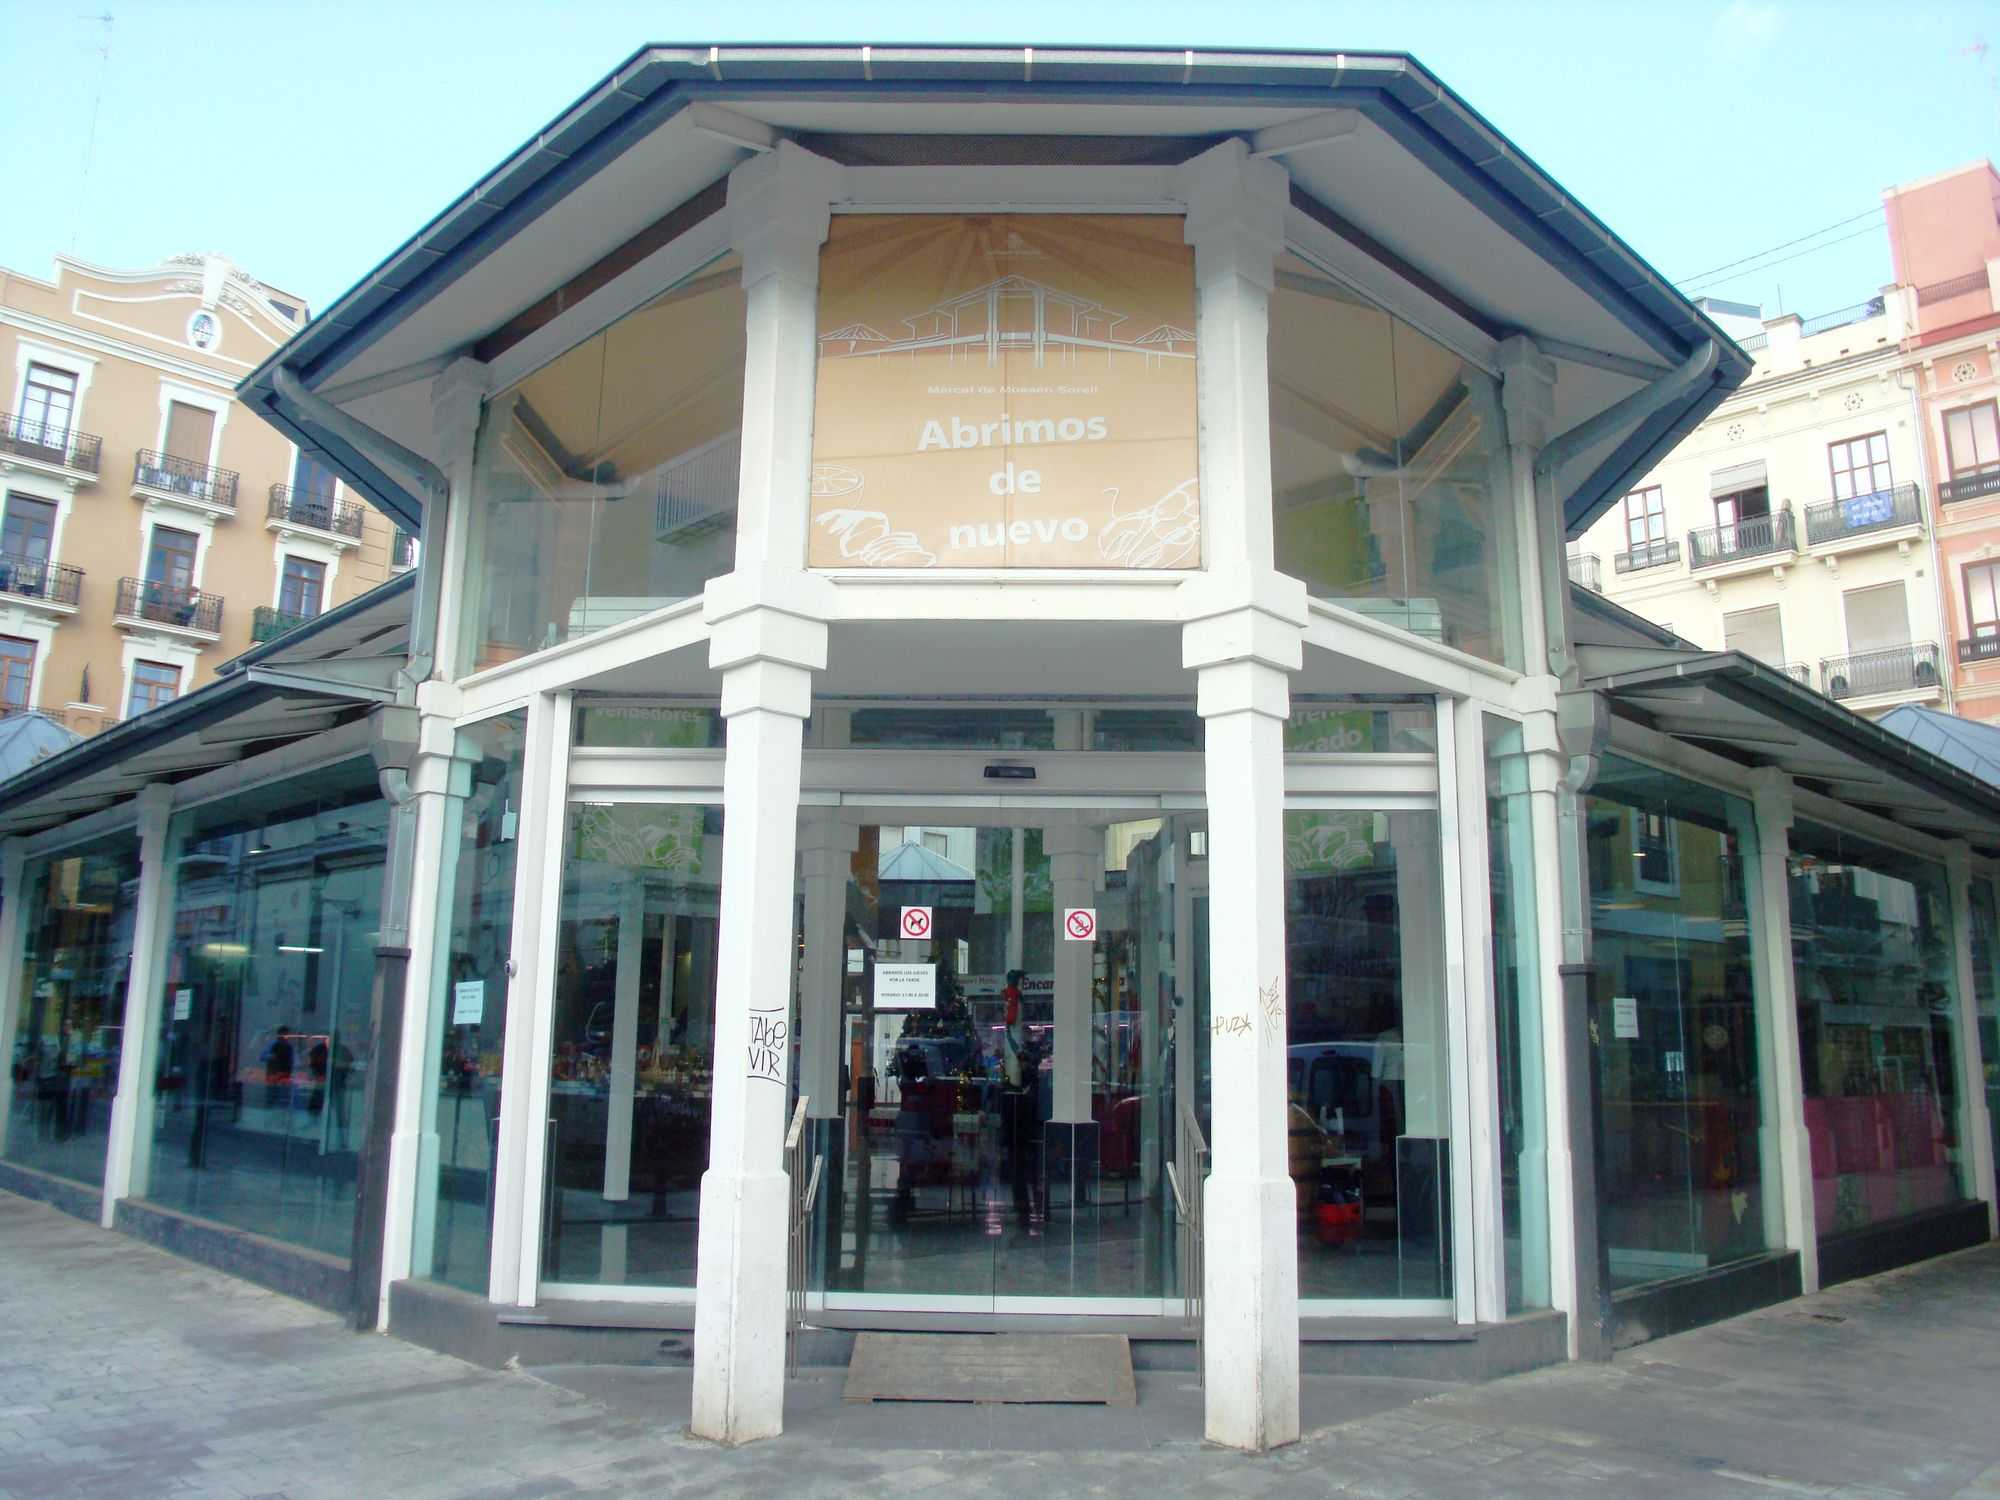
We present our new opportunity! This time across from the Mossen Sorell market.
This time we are going to show you how we do it at BrickStarter in a way that you will find as instructive as it is simple. We will take as a case study our Mossen Sorell apartment and show you the internal process we follow at BrickStarter when proposing this investment opportunity. To do so we present, as we usually do, the data that are part of our internal Big Data, so that they are as illustrative as possible. Let's begin.
1. SEPARATING THE WHEAT FROM THE CHAFF.
This is very important. You have to know what is interesting and what is not. We already talked in another article about the return on the Airbnb business and saw that to make the most of it you have to know where to invest.
That is why we analyze the range of homes that we present in the following chart in search of the most attractive type of property. In it we bring you the evolution over recent years of the properties created. They are divided by number of bathrooms and bedrooms, which from an investor's point of view is essential to take into account.
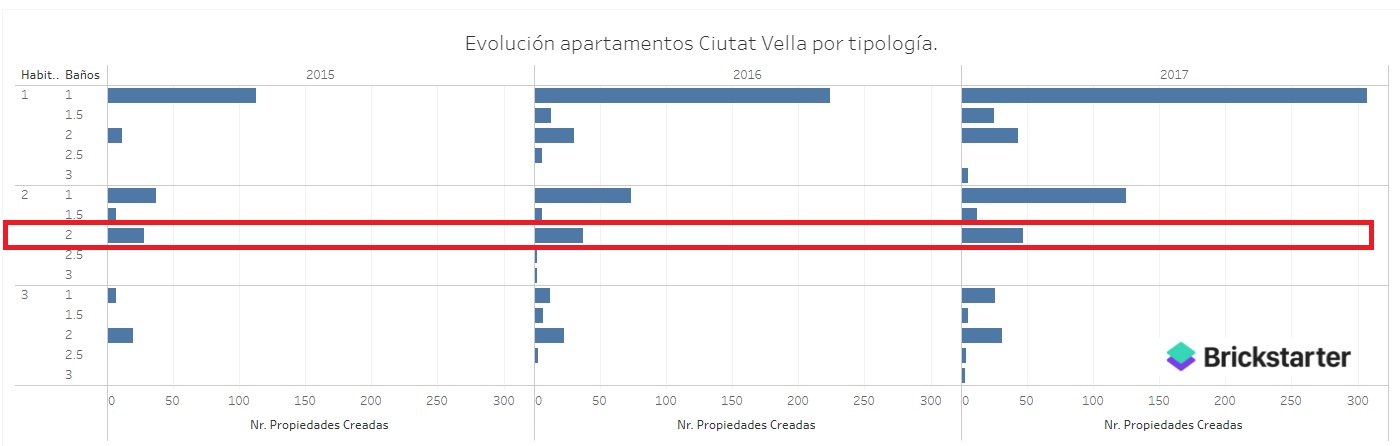
As we can see, there is a surplus of one-bedroom, one-bathroom homes. This is clearly seen when you analyze the evolution and projection of the average occupancy rate, as well as of the average daily income. The market is packed with this type of product; therefore, this type of property presents a higher risk of saturation.
Other options might prove more viable from an economic point of view. In this regard we had already ruled out a fairly wide range of the market.
2. LAW OF SUPPLY AND DEMAND
That led us to take an interest in the type of property that has two bedrooms and two bathrooms. Next, we move on to analyze the evolution of the main variables:
In this chart we can see many interesting things. On the one hand, we see the gradual entry into the market of properties with the aforementioned characteristics – 2 bedrooms and 2 bathrooms – which is very gradual, so the market could take a while to become saturated. On the other hand, we see the occupancy ratio, which evolves at a pace similar to that at which apartments with these characteristics are entering the market. And finally, the data point that points in the same direction is the growth in average monthly income seen in this type of property, which is evolving upward as you can see. The obvious conclusion to draw from this is the following: the data indicate that the new supply of this type has been absorbed by demand so far. It is a product that has demand and whose increase in supply is being absorbed by the market, so the main variables that affect income continue to show an upward trend. With this data in hand we decided to delve deeper into this type of property and estimate its potential return.
3. VERIFICATION.
In the following chart we can delve a little deeper into what we have been saying. The map shows the properties that we have taken as a sample for the study we present to you, all of them, as you can see, located in the center of Valencia, which we used for our verification process.
The average monthly income of all of them during 2017 is €1,832. The lowest average daily income in the sample was €84.93, a figure we took into account in our analysis. Likewise, we observed an average annual occupancy rate of 68.55% in 2017 in the sample analyzed; past data do not guarantee future results.
After analyzing all this data, at BrickStarter we have decided to propose the Mossen Sorell apartment as an investment opportunity. You can consult its fact sheet, with its complete information and its risks.
Past or estimated returns do not guarantee future returns. Investing involves a risk of total or partial loss of the invested capital.
Soon you will receive an email to confirm your Brickstarter account.
We hope to see you soon!
